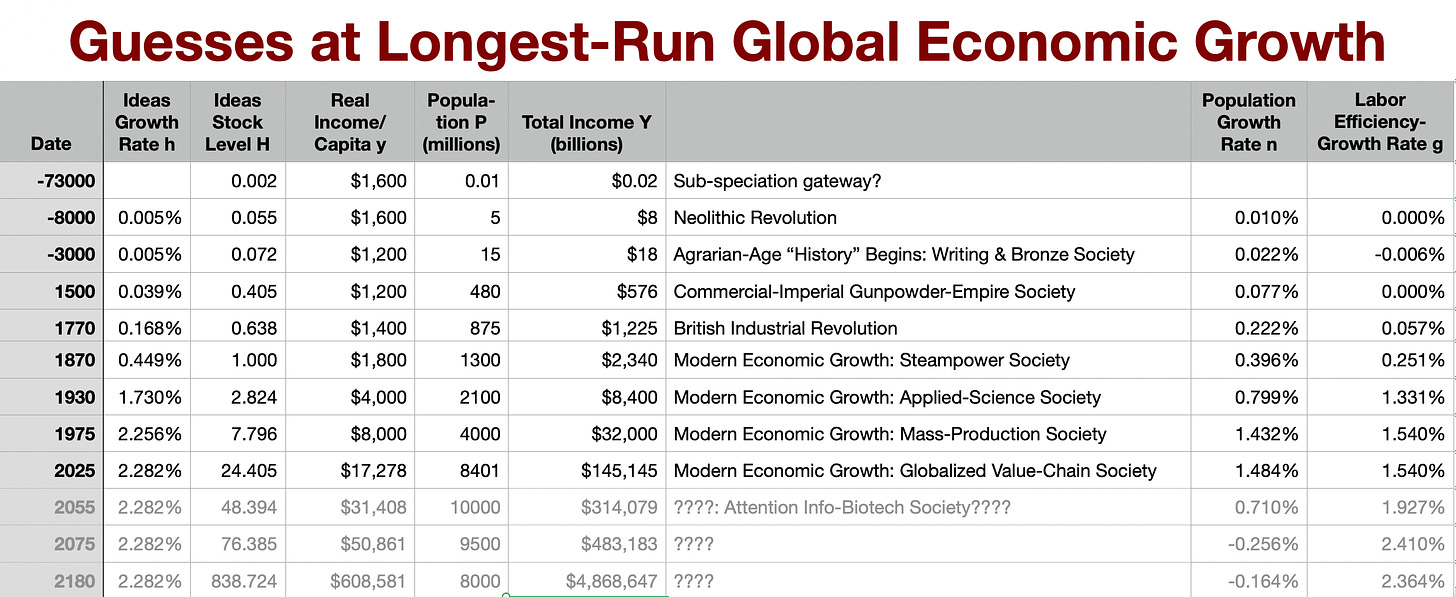
Paraphrasing the words of Dean Wormer in “Animal House”: somebody has to put his foot in it by being willing to set out their guesses, and that foot is me…

-
“Ideas Stock H” motived by asserting:
-
the relative constancy of capital-output ratios, and thus of the relationship between output per worker and per capita on the one hand and labor efficiency on the other.
-
the normalization that a 1% increase in production per capita at a constant population is also a 1% increase in the value H of the stock of useful human ideas about how to manipulate nature and coöperatively organize humans discovered and developed by human science and engineering, and then developed and deployed and then deployed and diffused throughout the human economy.
-
the guess that natural resource scarcity, historically, has been such that a 1% growth of the human population induces a 0.5% drag on labor efficiency—that ideas are twice as salient as natural resource abundance in generating labor efficiency..
-
-
The “population as of 75000 years ago” number here is especially fraught. As I understand it, probably more than 95% of us derive more than 95% of our ancestry from about 100 bands of about 100 East African Plains Apes that rarely intermarried roaming around East Africa. But the then-extant hominin population was much larger. Maybe 50 times as high? And there has been some gene flow into us from all hominin populations extant 75000 years ago.
-
The “$1600 and $1200” numbers for the real value of average per capita income are also extremely fraught, Yes, between 30% and 70% of human production was devoted to bare necessities—enough food, clothing, shelter, and heat that, given the sociology of the time, population did not actually decline. But calculating the true utility value of the conveniences, luxuries, and cultural public goods produced and the negative utility value of the domination exerted—truly valuing those flummoxes me. I do not dare claim that I have more than wild guesses as to how those changed both between 1770 and today and also during the long Agrarian Age since 10000 years ago that preceded the British Industrial Revolution and Modern Economic Growth eras. My wild guess is that our bare necessities share is now between 6% and 14%, and that we are 3.33 times as efficient in money-metric utility terms in our relative productivity and making conveniences, luxuries, and cultural public goods.
-
Future projections are perhaps the most fraught of all: truly off-the-wall wildest guesses. They are based on:
-
my belief that most things are in the end logistic curves,
-
the Principal of Mediocrity,
-
and the assumption that we will evolve a much more pro-feminist culture—one that truly values and supports the hard (but very rewarding) work of mothering the next generation.
-
If reading this gets you Value Above Replacement, then become a free subscriber to this newsletter. And forward it! And if your VAR from this newsletter is in the three digits or more each year, please become a paid subscriber! I am trying to make you readers—and myself—smarter. Please tell me if I succeed, or how I fail…

