Rough but edited lecture transcript. Part of Econ 135: The History of Economic Growth course unit 1. Introduction…
From Hunter-Gatherers to Post-Industrial Titans: Charting humanity’s economic journey up to and beyond the explosive leap after 1870 to Modern Economic Growth. Economic growth is one of humanity’s defining narratives, yet its history is one of long stagnation punctuated by one sudden recent breakthrough. Here we explore and journey through eras of limited progress to the transformative growth after 1870 that changed everything…
-
What the History of Economic Growth Is
-
Eagle-Eye Numeric Guesstimates of Economic Growth
This is Econ 135, Fall 2024, The History of Economic Growth, Economic Growth in Historical Perspective, The World Economy, as it has been, was, is, and will be.
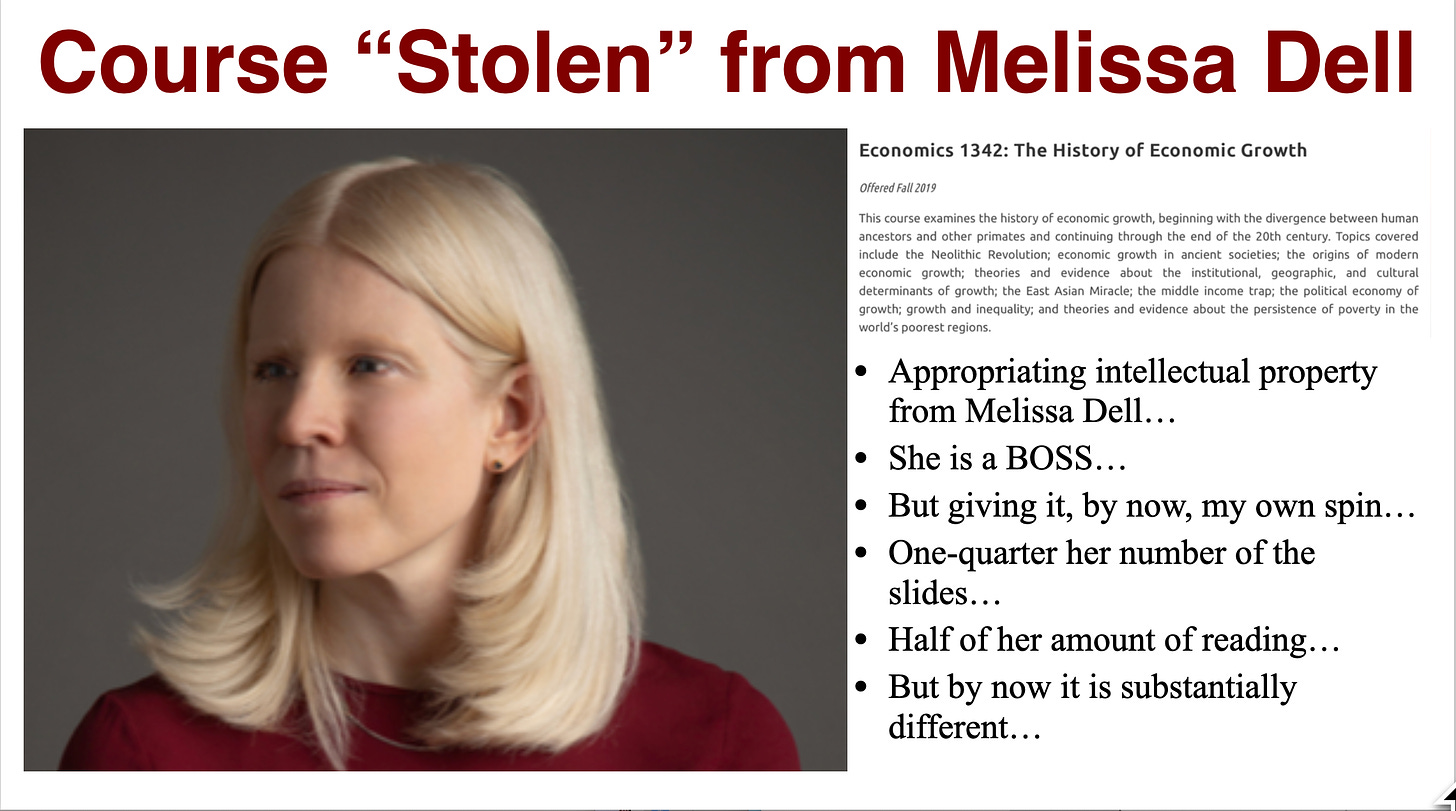
This course was stolen from Melissa Dell at Harvard, who is an absolute BOSS, and who taught the original as Harvard Economics 1342. I have borrowed very many of her ideas about global economic history and about how to teach it. If I say something particularly insightful, odds are 80% you should attribute it to Melissa. Conversely, you should attribute 100% of the stupidities to me.
Compared to the Harvard course, this one has 1/4 the slides and 1/2 the readings. The parents of the Harvard students are richer than yours, and have spent more on their upbringing than yours have, and that may have made them a little bit better academically prepared. But I don’t believe they have any cognitive advantage over you in terms of information absorption and processing. I expect you to do most of the reading here—but I will understand if you drop perhaps 1/3 of the readings because they do not sing to you. I do not understand how the Harvard students do the readings. My belief is that what they do is, first, frantically triage, and then, second, go hunting in the basement of Lamont Library for an article from the Atlantic Monthly or the New York Review of Books or something in whiuch somebody is writing about the assigned reading, reading that, and then faking it to sound half-intelligent in section.
Remember: Melissa Dell’s foundation, which is truly excellent. My spin. You can take a look at Harvard Economics 1342 if you want to see the differences. And I would be curious if any of you do to learn what you think about the differences, so if you do look, please come and talk to me afterwards.
This lecture is recorded for course capture. However, odds are that we will lose the audio for three of these lectures over the course of the semester. The microphone will run out of battery. I will forget to put the microphone on. There will be some other technical or user error.
So if you do not want to hike up the 150 vertical feet from Sather Gate mid-morning but would rather sleep in and watch the lectures online, know that you are likely to lose 10% of the lectures. Moreover, there is a real difference between presence and screen, even big screens. That difference doesn’t matter at all to a lot of people. That difference matters a huge amount to others. For many people, in addition, focus is better when you do things in groups, for we are animals—East African Plains Apes—primed to do things in groups. And we are also primed to maintain habits, and if there is not a regular class time we make for you or you make for yourself, you may well find yourself trying to watch 20 hours of video in the 40 hours before the final exam. Verbum sapienti sat est.
On the other hand, you are the videoscreen generation. And even in my generation there are those of us who love the recordings. You can rewind! You can go at half speed to take real notes! You can pause and think about whether what was just said makes sense! You can crank things up to doublespeed—which I confess I often do, and so when I do not think I have a lot to add in terms of comments, I often skip faculty seminars so I can watch and listen to twice as many as my schedule and calendar would otherwise allow. I sometimes try to do three—but that, I think, is probably a sign of mania and madness.
If that works for you, that is absolutely fine.
If that does not work for you, I strongly, strongly disrecommended at all. Figure out whether it works for you or not. Lots of people, lots of brains, lots of idiosyncrasy in how brains work. People learn in all kinds of different ways. A lot of success, of great success in life, turns on figuring out when your power cognitive hours are and what your power cognitive modes are. Figure that out.
Now to a great degree you all have already have done that, magnificently. If you did not already know when your power cognitive hours are and what your power cognitive modes are, then you would not be here as students at UC Berkeley. The typical American teenager and post-teenager is not where you now are, and would be quickly lost if they were here.
But there is always space for continual improvement.
We know a lot about the past century and a half—back to 1870 or so. And we know enough, maybe back to 1500, that we can truthfully say that we know enough to say reliable things.
For the past century and a half, we have had access to extensive economic data collected by governments, bureaucracies, and information processing systems. This data allows economists to produce fairly accurate quantitative pictures of wealth distribution and economic trends. Prior to 150 years ago, we lacked comprehensive statistical systems focused on the economy as a whole. In the late 1800s, debates about socialism versus capitalism spurred the creation of labor statistics bureaus, first at the state level in Massachusetts and then nationally in the United States. These bureaus began systematically collecting and analyzing data through surveys of the labor force. Today, the monthly employment report released by the U.S. Bureau of Labor Statistics is considered a crucial piece of economic news, reflecting our substantial trust in the statistical system.
Before the 20th century, governments primarily collected economic data for the purpose of taxation, rather than comprehensive economic analysis. However, historians can still piece together reasonably accurate economic trends dating back to around 1500.
In summary, the availability of reliable economic data has dramatically improved over the past 150 years, transforming our ability to understand and monitor economic conditions.
Before 1500, our knowledge of real income and wealth levels and of populations is very thin. For example, with respect to the late Roman Empire, most of what we guess is primarily based on a single document—the early 300s Price Edict of the Emperor Diocletian. This edict covered a wide range of prices, from wheat to skilled labor. However, the nature and purpose of this edict is unclear. It’s uncertain whether it was merely a suggested price list, a directive for the military, or an attempt to control inflation through binding price controls. There are also questions about how widely it was actually enforced, if at all, beyond the urban centers with the strongest bureaucratic presence.
Before 1500, reliable census data or tax records that could shed sufficient light on income and wealth levels to make whatever numbers we construct more than are best informed guesses simply do not exist. We have price lists, income records, occasional writings by then-contemporary observers trying to construct “social tables” for their societies. and inferences based on the size of thigh bones (femurs) found in archaeological excavations. Femurs and other bones can provide enormously valuable insights into the general health and nutrition of past populations. But anything like true time series data? Almost never.
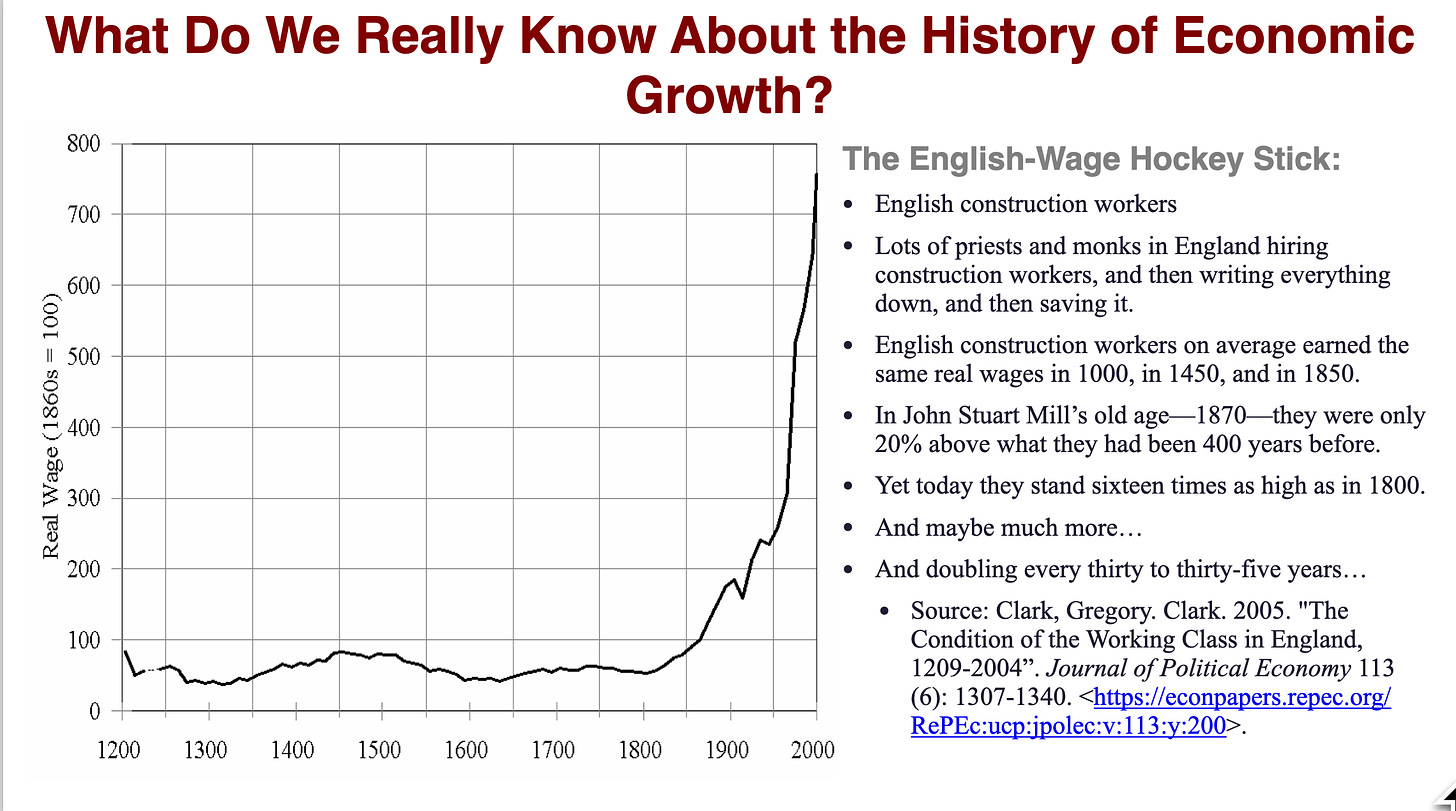
We do have one very good time series on real wages and living standards. The church in England maintained detailed records of its financial activities from 1200 onward. These records provide valuable time series data on the wages paid to construction workers hired to build and repair churches and monasteries. Additionally, the records include detailed information on the prices churches and monasteries paid for goods and services. This wealth of financial data exists because the Church in England was a highly literate and bureaucratic institution. Bishops closely monitored the buying and selling activities of the people under their authority, requiring their accountants to maintain meticulous records.
Gregory Clark, a friend of mine since I was 19 and a former distinguished professor at UC Davis, has recently moved to the University of Southern Denmark. Clark wrote an article titled “The Condition of the Working Class in England, 1209 to 2004,” which is an echo of Friedrich Engels’ famous The Condition of the Working Class in England written in and about the 1840s. In his article, Clark analyzed this historical datasdt on the prices paid by monasteries and churches for goods and services, as well as the wages they paid to construction workers. With some assumptions about the typical spending patterns of carpenters, we get very good estimates of real wage and living standards for carpenters who worked for the church.
And of course, there are great worries about what this means. In the Middle Ages, most people were serfs or slaves, not wage workers. Those who were not serfs or slaves were often apprentices or journeymen in long-term relationships. It was relatively uncommon for people to leave their usual occupations to work on church repairs for an extended period. This raises questions about how the churches obtained these workers. Did they have to offer better working conditions and higher wages to lure people away from their regular jobs? Or were these workers individuals who lacked secure positions in the status-based social hierarchy, and thus were pushed by the system to accept whatever work was available? If so, the church may have exploited their vulnerable position by underpaying them. Additionally, it is unclear whether the church was seen as an organization that provided fair prices, or one that could demand volume discounts due to its size and power. These issues remain debatable and are debated.
I am going to assume that these numbers are what they are, and that they tell us what we think they tell us. These available data strongly suggest that the real wages of English construction workers remained relatively stable over the very long period from the Middle Ages through until the end of the 1800s. In 1870, the real wages of an English carpenter were only about 20% higher than they had been for most of the medieval millennium. This indicates that even for a relatively skilled worker like a carpenter, who had specialized knowledge and abilities, their wages were still largely devoted to basic subsistence for themselves and their families, likely accounting for an average of 40% of their total income. The data paint a picture of stagnant real wages, at least for this segment of the English working class, until what is for historians the very recent past indeed. over the course of several centuries. And these are skilled workers. Typical unskilled workers would have had to spend more than 40% of their incomes on bare subsistence for themselves and their families.
Let us be very clear what “bare subsistence means”. It means 2,000 calories per day, plus essential nutrients. It means enough calories per day that you can work, but not work very hard for very long. Plus it means enough clothing that you were not shivering, thinking about how cold you were, much of the time. This is England, after all. And enough shelter that you’re not spending much of your time thinking about how wet you are—this is England after all.
Today, or rather back in 1997, English carpenters’ real incomes were 16 times as much as the medieval standard. Wage, income, and standard of living stagnation up to 1870. Then explosion.
There is one other major consideration. People today have the power to utilitze a great many kinds of goods and services that people back in the Middle Ages, indeed even people 50 years ago, could not. If I want to watch MacBeth on a big screen, a very large version of MacBeth in my house tonight, I can fire up the 60-inch TV and watch any of 35 different performances of Macbeth, Game of Thrones, Buffy the Vampire Slayer, or whatever. Or watch any of a huge number of other things, literally for pennies. And big screen—I do not even have to go where there is a big screen. I can do it anywhere I can find a chair, as long as I am accustomed to using a MetaQuest or an AppleVision headset, and then I can have not a 60-inch screen but a virtual 300-inch screen twenty feet from me.
If you say you wanted to watch Macbeth in your home in 1605, there was one person in the world who could do that. He was named James, he was king of England, he lived in Whitehall Palace, and he had William Shakespeare, and Shakespeare’s acting company on retainer. And even he could only do that if Shakespeare’s acting company had Macbeth than currently in repertory. Figure 50 people in terms of stagehands, scene painters, and so forth. You amortize fixed costs, rehearsal costs, Shakespeare’s writing time over a while. So figure 50 people for one full day—that is 400 man hours—to put on a performance of Macbeth in 1500. At $15 California current minimum wage, 400 man hours times 50 is $6,000 as compared to today’s cost of pennies for electricity plus maybe a dollar for equipment amortization. That’s a factor of 6,000 times richer than someone back in 1605 by the watching-Macbeth at home standard.
And, even more, back in 1605 you had to have the right social network. You had to have Shakespeare’s acting company on retainer.
Where are the commodities where productivity hasn’t increased? How are those industries so important that when we average that factor of 6000 with all the other factors, we come out with 15? So maybe 15 is a big underestimate.
You can go back and forth on these issues, and we do.
Now here’s the kicker.
England was particularly notable from around 1800 to 1920, as it was the first country to undergo the Industrial Revolution and reached the highest proportion of its labor force in manufacturing. However, before 1700 and after 1920, England does not stand out significantly compared to other major Eurasian civilizations. Prior to 1700, the average standard of living in England was not markedly higher than in places like China or India. And after 1920, England’s economic performance was more on par with other relatively wealthy countries. The perception that the average person in China or India was quite poor compared to England only really emerged around 1850. Before that time, the living standards across these major Eurasian civilizations were more comparable.
Prior to 1700, accounts from visitors to the major Eurasian empires, such as the Ottoman, Persian, Mughal, and Chinese empires, suggest that these societies were generally orderly, prosperous, and the upper classes were exceptionally wealthy, far exceeding the riches of the European elite. There is no evidence that England was significantly richer or poorer than other parts of Eurasia before 1700. Based on this historical information, we can cautiously infer that the relative economic standing of different regions had remained relatively stable for centuries if not millennia beforehand.
We can trace written records back 5,000 years in Mesopotamia. Based on the price lists from that time, it appears that the typical worker spent 40-60% of their income on the bare necessities—2,000 calories of food plus essential nutrients, shelter that protected them from the elements, and enough clothing to be presentable in public. Same-old, same-old—before the post-1870 era of Modern Economic Growth that sees income and productivity levels truly explode.
That’s what we know about the history of economic growth in terms of how rich the typical person was, in terms of what incomes were, and what people could actually buy with the course of their lives, plus the incredible narrowing of the different kinds of goods and services that you could obtain.
It was a huge deal back in Ireland in 750 when the bard came to sing at the campfire.
It was a huge deal back in Greece of year -700 or so when someone who knew the two poems of Homeros, the Iliad or the Odyssey, came by to chant them.
King Alexandros II Argeadai of Makedonia, Alexander the Great, on his conquest expeditions from year -336 too year -323, always carried with him his copy of the Iliad. Plutarkhos of Khaironea tells us:
Among the treasures and other booty that was taken [at the Battle of Issos] from Darius [Darayavush], there was a very precious casket, which being brought to Alexander for a great rarity, he asked those about him what they thought fittest to be laid up in it; and when they had delivered their various opinions, he told them he should keep Homer’s Iliad in it…
The casket was not necessarily the most valuable part of the ensemble. The Price Edict of Diocletian sets the price of writing a good copy of 100 lines at the daily wage of an unskilled worker. At 16,000 lines, the cost of writing out a copy of the Iliad is thus 2 unskilled man-years
So that is average incomes.
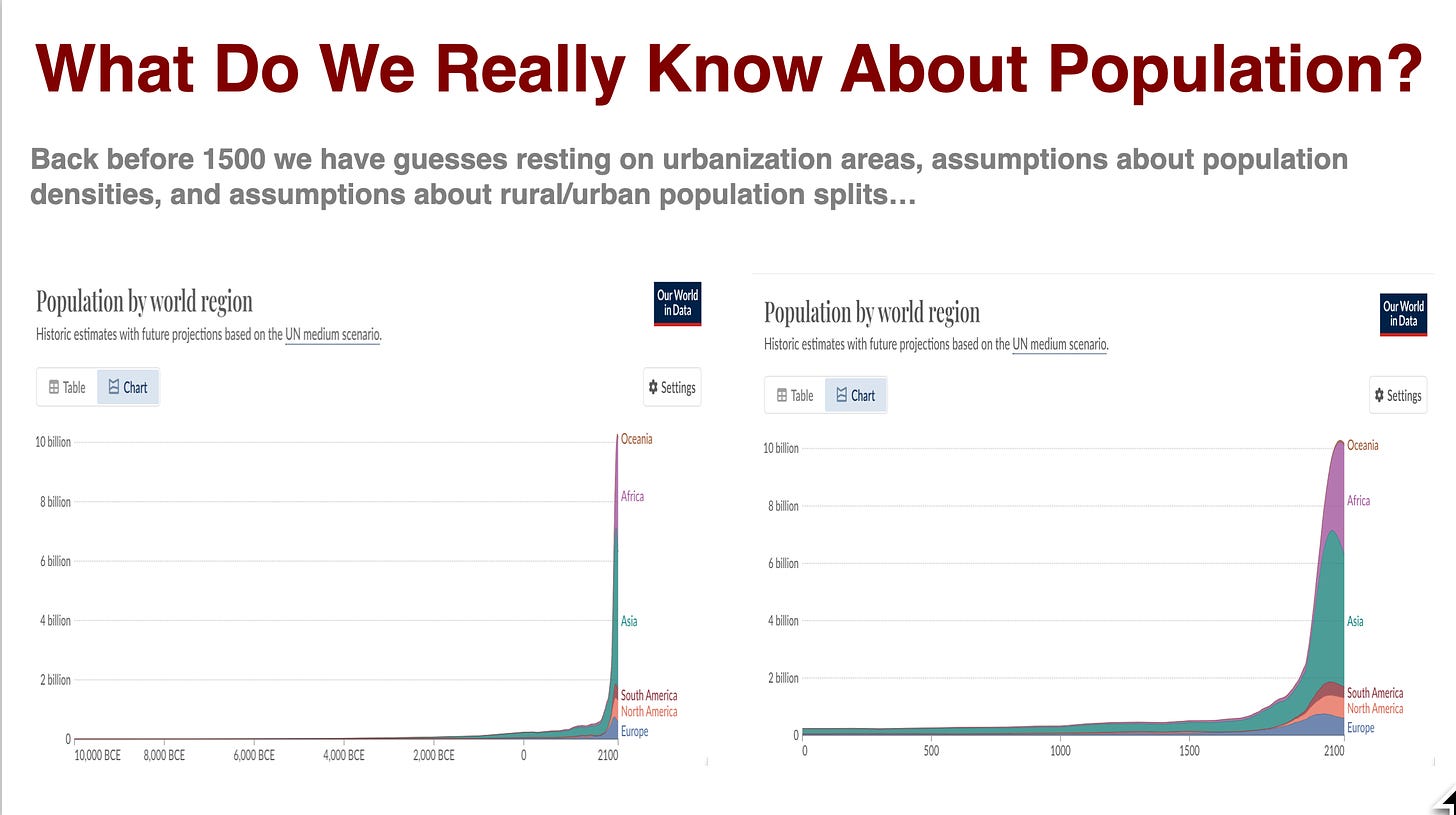
We have reliable government statistics on global population since around 1870. At that time, the world’s population was approximately 1.3 billion. Today, the global population is close to 8.3 billion and is projected to peak at around 10 billion by the end of this century, after which it is expected to slowly decline. Prior to 1500, we do not have definitive population data. Instead, we rely on estimates based on historical records, archaeological evidence, and assumptions about population density and urban-rural distribution. These methods provide us with educated guesses about the size of the human population before detailed modern census data became available.
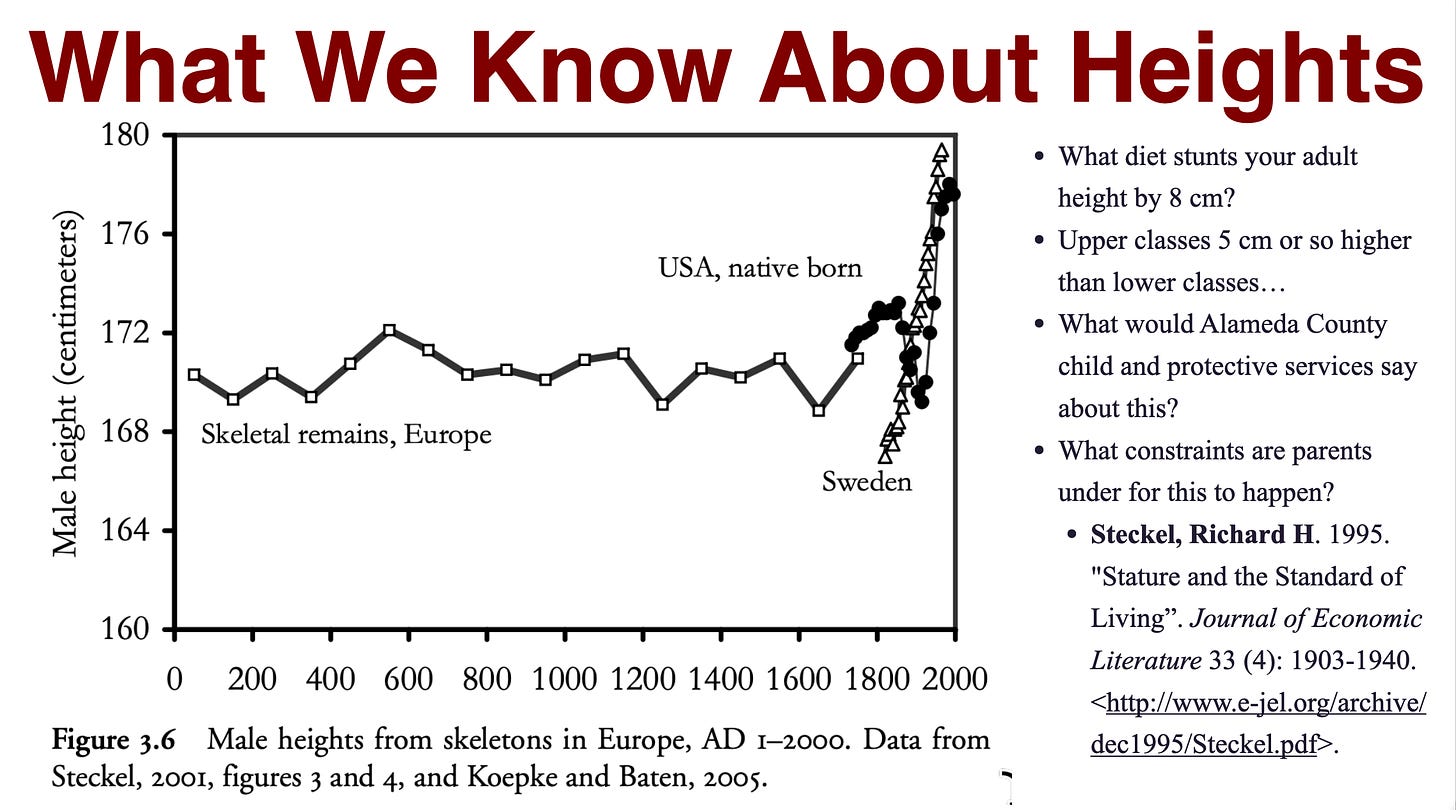
There is, as I said before, there is one more piece of real information we have. It comes from bones. We have been digging up femurs as archaeology has transformed itself from the Heinrich Schliemann and Indiana Jones “let’s find some incredibly precious and magical things” to “let’s dig through lots of dirt looking for pollen, pots, and bones”. What we find is that, back before 1850 or so, people were an average of 8 centimeters, 3.25 inches, shorter than we are. And we also find that upper classes are 2 inches taller than lower classes. When we hear someone upper class back in the Middle Ages called “high and mighty”, that is not really a metaphor.
What kind of diet would I have had to feed my children to kind of stunt them by 3 and a half inches? What kind of parent would want to feed their children such a diet in which they were hungry all the time If they could possibly avoid it? Had we tried to feed our children that diet while they were growing up here in Alameda County, there’s an organization called Alameda County Child and Protective Services that would have come and would have taken our children away.
The standard line about how parents feel about their children comes from the Iliad, the first of the two epic poems attributed to Homeros. The Trojan prince Hektor prays to the gods for his young son Astyanax:
Zeus and other gods, grant that this my son may become
as I am, preeminent among the Trojans, as mighty in strength,
and rule Ilium with his might. And may men say of him,
‘He is far better than his father,’ as he returns from war…
from the poem “The Iliad,” in which Hector, a Trojan prince, is praying to the gods about his young son Asteanus and saying, “May he grow to be tall and mighty and wise. May he lead the Trojans out to battle and bring them afterwards back home. And may people say he is a better man than his father.” Omer’s a skillful artist, a skillful writer, and of course this is immediately followed by the child seeing Hector in his full armor for the first time and wailing in terror. And indeed foreshadowing of Hector getting killed late in the Iliad by the Greek hero Achilles. And later on, Asteanus getting killed still as a small child by Achilles’ son Neoptolemus, because Neoptolemus thinks, “Well, why not? And if I let this kid live, he is going to come hunting for me because my father killed his father in 20 years.”
If parents could have given their children a good diet, they would have. The fact that they did not, the fact that people in the past were three and a half or more inches shorter than we are, shows you what kind of diet they had. Protein deficiency, calcium deficiency, vitamin D deficiency—all kinds of things to stunt you substantially. People were short pretty much everywhere. We are certain it was due to poverty, for the upper classes are taller.
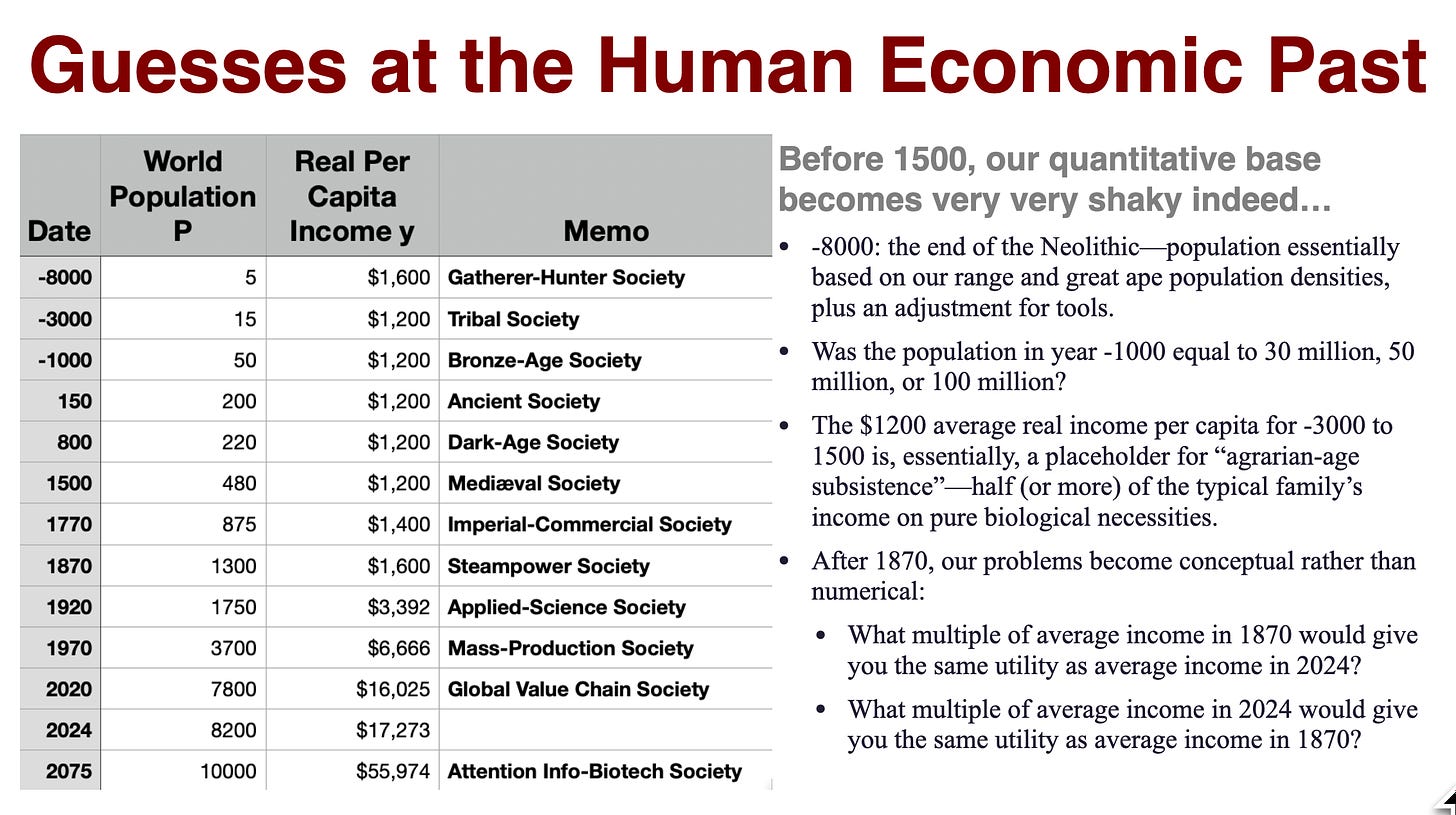
This table here is something I want you to have in your minds for the rest of your lives. Thou shalt write them upon thy posts and on thy gates that lead to thy intellectual home. I want you to see this table, and be reminded of it, when you go in, and when you come out:
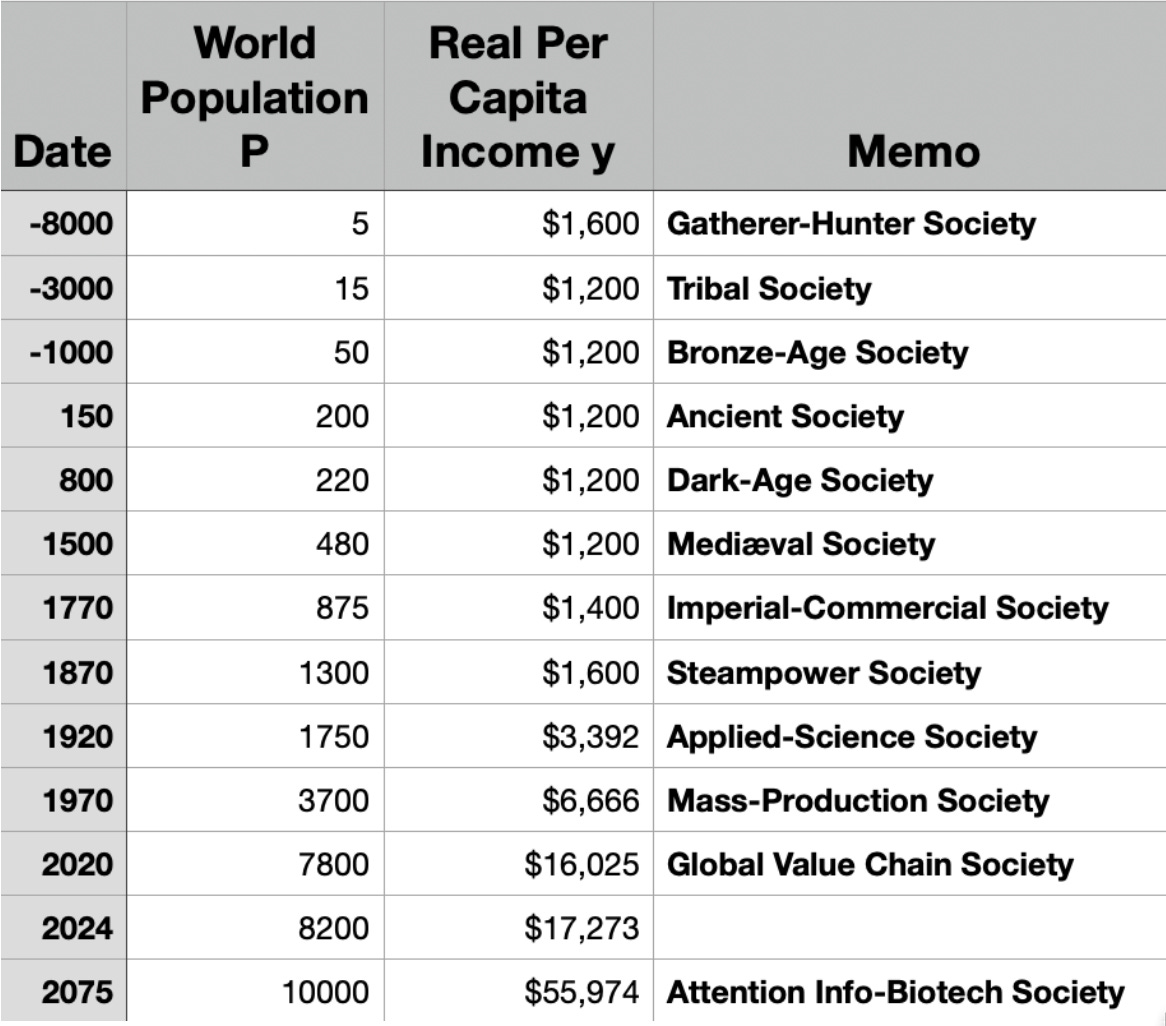
The global population is projected to reach approximately 10 billion by 2075, if the ongoing demographic transition in Pakistan, Iran, and much of sub-Saharan Africa continues. Currently, the global population stands at around 8.2 billion. In 2020, the population was 7,800 million (7.8 billion), compared to 1.3 billion in 1870 and 480 million in 1500. Prior to 1500, population estimates become more uncertain.
Most experts believe the global population was around 200 million (with a range of 30% higher or lower) in 800, and slightly lower in 150. Going further back, most experts believe the population was around 50 million in 1000 BC, but some higher projections suggest it may have been as high as 100 million. The population numbers decrease further as we go further back in time.
Truth be told, we really don’t know. We know that cities were small. In the year 100, the only large cities in the Mediterranean basin of 100,000 or more were Rome, Antioch, and Alexandria. And beyond the reach of the sea, archaeological evidence suggests there were no major cities in Eurasia west of Babylon
Back before, we have guesses, and when we get to minus 8,000 BC, what we’re really doing is we’re running off of what gorilla and chimpanzee population densities are in the wild, in their habitats, plus an adjustment for the fact that we then had tools, which gave us the teeth and claws that we do not have, plus the fact that our range was pretty much the entire known and unknown world on land by then, that we really had figured out technologies so we could live at normal ape population densities pretty much everywhere.
That gets us from a population of 5 million 10,000 years or so to 200 or so million in the year 150, just before what I think of as a late antiquity pause up to 800 in which population grew little. And then population grows to perhaps 480 million people in 1500, 1.3 billion in 1870, and 8 billion or so today.
If Modern Economic Growth continues, we project average global annual income per capita at approximately $57,000 by 2075. In comparison, the current per capita income in the United States is around $65,000. Our estimates are that global per capita income has grown from around $3,300-$3,400 in 1870 to $17,273 in 2024. This is a roughly 10-fold increase in average living standards compared to 1870. Prior to 1870, global economic growth was slower, with estimates suggesting the typical person lived at a near-subsistence level of around $1,200 per year by 1500. This level of income would have required 30-60% of earnings to be spent on basic necessities.
As we move further back into the more distant past, prior to the advent of agriculture, during the Mesolithic era, we find that the femurs of hunter-gatherer societies grew longer again. The average adult height of these populations was comparable to modern standards, suggesting they were physically robust and fit. Living as a hunter-gatherer required a high level of physical capability, as it was a demanding lifestyle. Sustaining an injury, such as a broken leg, would have posed a significant challenge to long-term survival, as the ability to keep up with the group’s movements and activities would have been compromised. Be fit or die seems to have been the rule—in striking contrast to the facts of the matter in the later Agrarian Age.
Before the advent of agriculture some 10000 years ago, population densities were lower and people were much fitter. People were generally healthier, taller, and less hungry in the pre-agricultural period. Diet and lifestyle were healthier, compared to what happened after the introduction of agriculture. Subsistence farming, while a difficult way of life, did not require the same level of physical fitness as earlier hunter-gatherer societies. The tasks involved in farming did not demand a person’s full strength or endurance, and were more limited by the number of calories they could consume and expend, rather than the quality of their muscles. Thus we guess that the average person’s annual per capita income was pegged around $1,600 before 10000 years ago, compared to $1,200 after the transition to agriculture.
During the Agrarian Age, peasants and craftsmen had some access to the cultural benefits of civilization, if civilization really does have benefits for the non-élite. They could listen to stories like the adventures of Odysseus, which we tend to value highly. However, they were significantly worse off in terms of biomedical and nutritional wellbeing than their Gatherer-Hunter Age predecessors. John Stuart Mill claimed in the 1870s that the mechanical inventions of the time had not actually reduced the daily toil of the average person. While these inventions allowed for a larger population to live, that population was, Mill said, still trapped in “the same life of drudgery and imprisonment”.
The key question is why the majority of humanity continued to live in poverty and hardship despite the technological advancements between 8,000 BCE and 1870 CE. On average, people were no wealthier in 1870 than they were during the hunter-gatherer era, even though there had been significant technological progress over that period. Unpacking this further, the answer lies in understanding why the economic growth driven by technological innovation did not translate into higher living standards for the general population until after 1870. What factors prevented the benefits of technological progress from being more widely distributed prior to that time?’
That’s what we’re going to be trying to figure out over the course of this course.
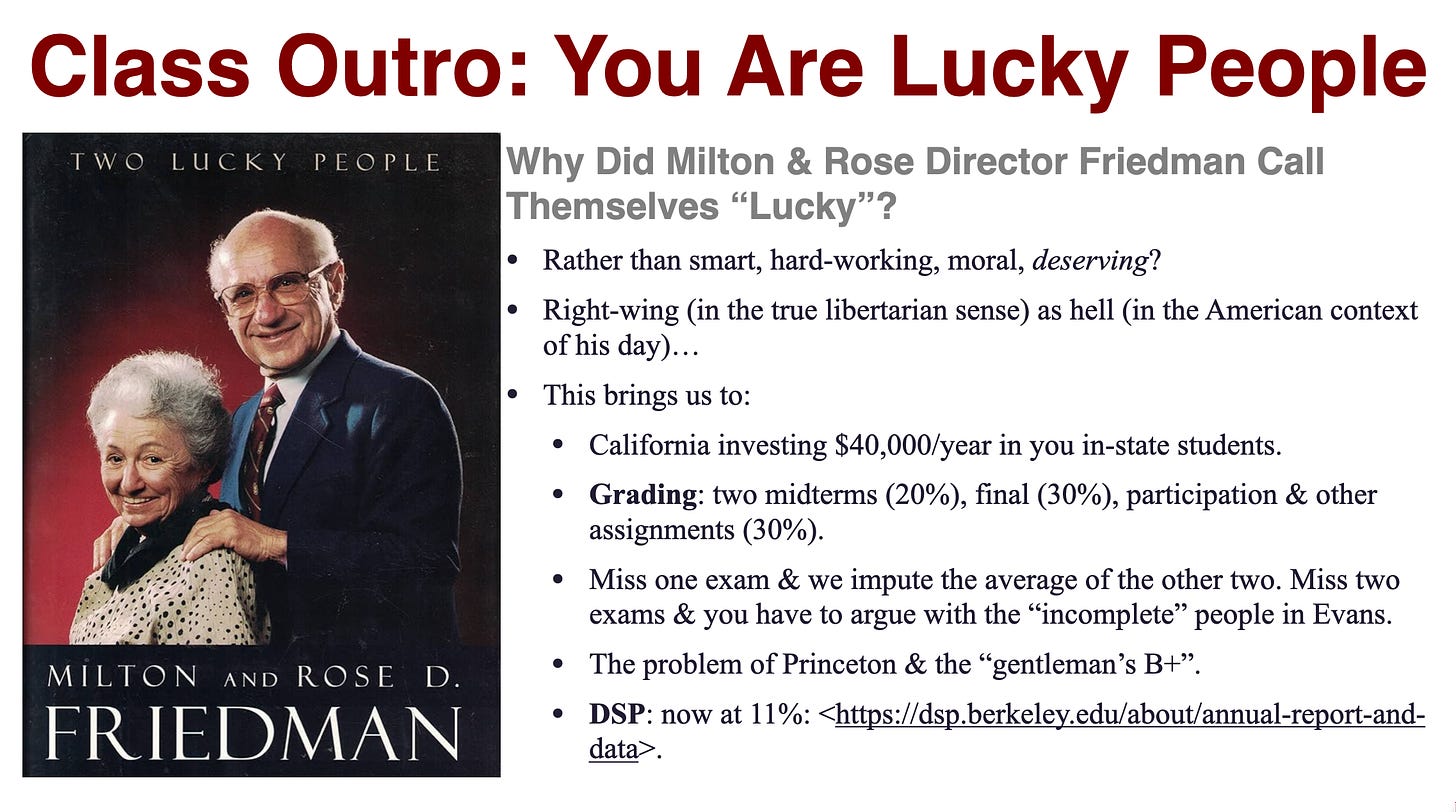
Milton Friedman, a prominent libertarian economist, and his wife Rose Director Friedman titled their autobiography Two Lucky People. Despite Friedman’s right-wing political leanings, he did not portray himself and his wife as particularly smart, hardworking, or deserving. Instead, they acknowledged the role that luck played in their success and influence. Friedman recognized that his upbringing and the opportunities available to him were significant factors in his achievements. He was fortunate to have parents who helped shape him into someone able to capitalize on the chances presented. This insight applies more broadly – much of an individual’s success is due to the circumstances they are born into, rather than solely their own merits.
California invests $40,000 annually in each in-state student and does not ask to be paid back, even though these students are likely to earn more than the average Californian over their lifetime. The state makes this investment because it believes that supporting capable individuals who can excel in cognitive tasks will produce people who will make significant contributions to themselves, their families, the state, the country, and the world. As your instructor, my role is to ensure that you learn extensively during your time at Berkeley, so that this investment can be repaid. To this end, your grade will be determined by two midterms, a final exam, participation, and other assignments.
Participation in class, during office hours, and other discussions is crucial. The university’s intellectual community was disrupted during the pandemic, and we need to rebuild it. Encouraging participation is one way to do that. If you miss one exam, we will use the average of your other two exam scores to fill in for the missed exam. If you miss two exams, you will need to speak with the administration in Evans Hall about receiving an incomplete grade instead of an F.
The grades we give here serve two main purposes. First, they provide potential employers with credible information about your academic performance. We believe that giving honest grades is the best way to fulfill this function and assist you in your transition after Berkeley. Second, grades help us identify areas where you may be struggling, so we can intervene and ensure your success. As a public university, we are investing a significant amount of money ($40,000 per year for in-state students) in your education. We want to make sure things go well for you here at Berkeley, as we know you are highly capable of succeeding. In summary, grades are important both for communicating your abilities to future employers and for helping us support you throughout your time at the university.
This brings me to the last point I want to make, which is this:
The Disabled Students Program (DSP) currently comprises 11% of the student body. This percentage is significantly higher than the original intent of the Americans with Disabilities Act.
Additionally, as I see it, there are an equal number of students without a DSP-designation who would benefit as much as the median student with a DSP-designation from appropriate accommodations, but do not have them. I do think this bureaucratic system with standardized buckets of “accommodation” is not the optimal way to deal with the fact that people have different cognitive strengths and weaknesses, and thus different learning styles.
It is important to note that “disability” in a cognitive sense here is a legal term, a term of art. It is not a reflection of any fact that any student here is in any real sense lacking in cognitive ability. Nobody here is “disabled” in the sense of not being able to perform at the level of cognitive functioning typical of human beings—you are all excellent at cognition, or you would not be here. All of you are highly capable on average across the wide range of modes of human intelligence.
However, people do have relative strengths and weaknesses, and do have diverse learning styles. We have an obligation to teach our curriculum in a way that aligns with how your brains best learn. We learn differently. Many of us are “differently abled“ and that is in no sense any kind of euphemism.
If you are part of the DSP or believe you could benefit from accommodations due to your unique learning style, please submit your DSP forms as soon as possible. Additionally, if you think you would benefit from some form of accommodations because of your learning style, come and talk to us as soon as possible whether or not you are in the DSP system. Feel free to speak to us about your needs. We will attempt to make the adjustments to support your academic success.

If reading this gets you Value Above Replacement, then become a free subscriber to this newsletter. And forward it! And if your VAR from this newsletter is in the three digits or more each year, please become a paid subscriber! I am trying to make you readers—and myself—smarter. Please tell me if I succeed, or how I fail…

