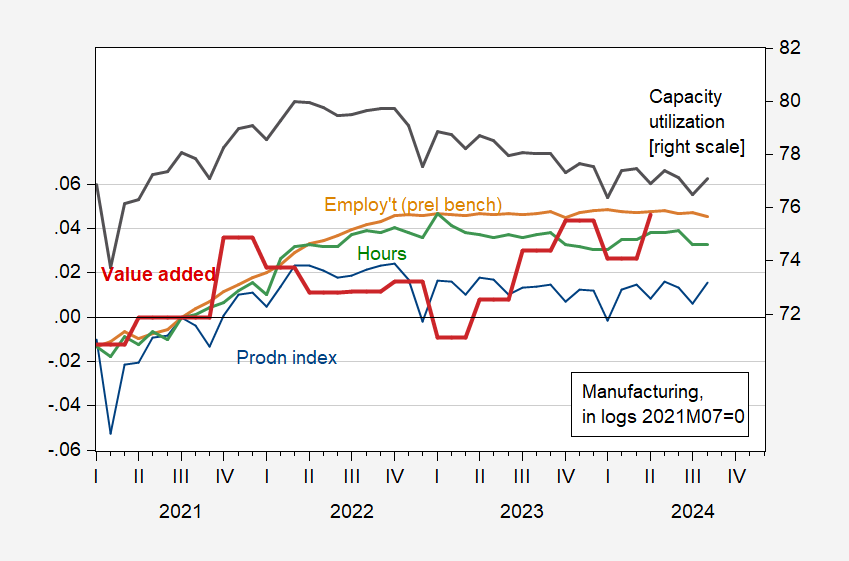
High frequency indicators (PMI, etc.) suggest — and have suggested — a slowdown in manufacturing. Still, other indicators indicate sideways trending. Here’s a picture, incorporating the just-available manufacturing value added for Q2, as well employment incorporating the preliminary benchmark revision.
Figure 1: Manufacturing production (blue, left scale), implied employment from preliminary benchmark (tan, left scale), aggregate hours (green, left scale), and real valued added (red), all in logs, 2021M07=0, and capacity utilization in manufacturing, in % (black, right scale). Source: BLS via FRED, Federal Reserve, BLS, BEA via FRED, NBER.
I do wonder a little about extrapolations from manufacturing to the rest of the economy. While manufacturing might be a leading indicator (that’s dubious), it’s been declining share of overall economic activity for decades.
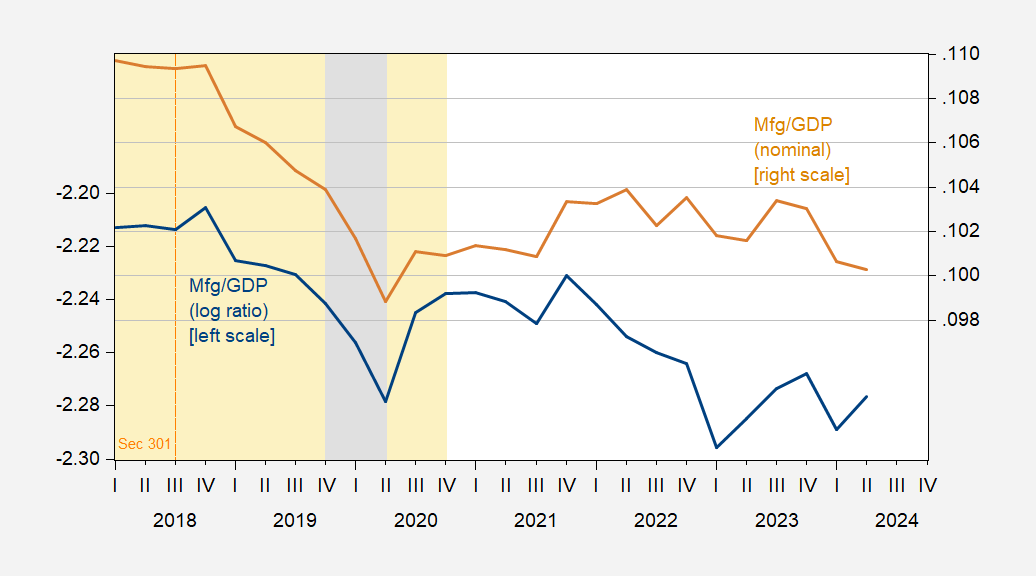
Figure 2: Log ratio of real manufacturing value added to GDP (blue, left scale), and manufacturing to GDP share (tan, right scale). NBER defined peak-to-trough recession dates shaded gray. Orange shading denotes Trump administration. Source: BEA 2024Q2 release/annual update, NBER, and author’s calculations.
In fact, manufacturing sector value added declined substantially in the wake Trump trade war (even before the pandemic). So, we should be interested in manufacturing to the extent that it’s a large share of the economy (about 10% in value added terms). However, the manufacturing sector could be in recession (however a sectoral recession is defined) without the rest of the economy suffering one (as defined by NBER).


